Best indicator for swing trading?
There’s no single “best” indicator for swing trading, as the most effective approach often involves combining several indicators and adapting them to market conditions and your personal trading style. However, some indicators are consistently popular and effective for swing traders due to their ability to help identify trends, momentum, volatility, and potential reversal points.
Here are some of the most highly regarded indicators for swing trading, and why they are useful:
1. Moving Averages (MA)
What they do: Smooth out price data over a specific period, making it easier to identify the overall trend direction.
Why they’re useful for swing trading:
Trend identification: Help confirm if a stock is in an uptrend, downtrend, or sideways trend.
Support and Resistance: Moving averages can act as dynamic support or resistance levels.
Crossovers: When a shorter-term moving average crosses above a longer-term one (e.g., 50-day EMA crossing above 200-day EMA), it can signal a bullish trend reversal (Golden Cross). The opposite (Death Cross) signals a bearish reversal.
Common types: Simple Moving Average (SMA) and Exponential Moving Average (EMA). EMAs give more weight to recent prices, making them more responsive.
2. Relative Strength Index (RSI)
What it does: A momentum oscillator that measures the speed and change of price movements. It ranges from 0 to 100.
Why it’s useful for swing trading:
Overbought/Oversold conditions: Readings above 70 typically suggest an asset is overbought and might be due for a pullback or reversal. Readings below 30 suggest it’s oversold and could be due for a bounce.
Divergence: When the price makes a new high but the RSI makes a lower high (bearish divergence), it can signal a weakening of momentum and a potential reversal. The opposite (bullish divergence) can signal an impending upward reversal.
3. MACD (Moving Average Convergence Divergence)
What it does: A trend-following momentum indicator that shows the relationship between two moving averages of a security’s price. It consists of the MACD line, a signal line, and a histogram.
Why it’s useful for swing trading:
Momentum shifts: Helps identify shifts in momentum and potential buy or sell signals when the MACD line crosses above or below the signal line.
Trend confirmation: Can confirm the strength and direction of a trend.
Divergence: Similar to RSI, MACD divergence can signal potential reversals.
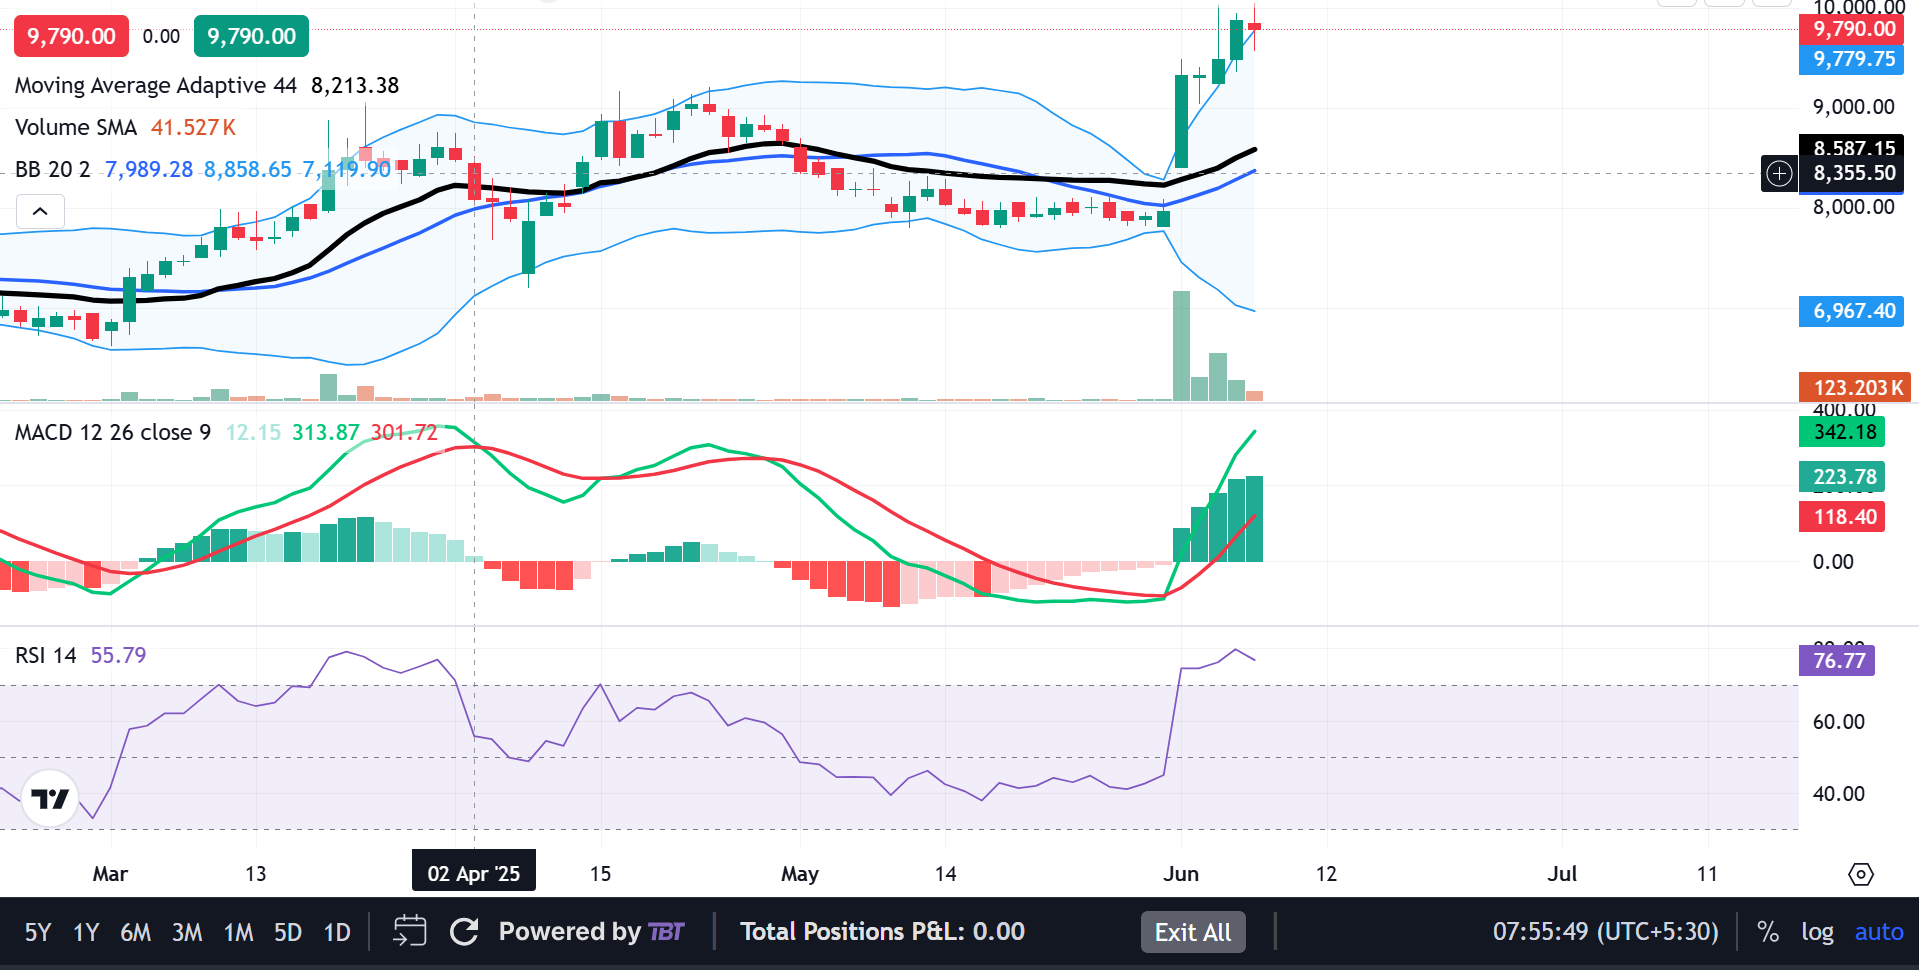
4. Bollinger Bands
What they do: Measure market volatility and consist of a middle band (typically a 20-period simple moving average) and two outer bands that are two standard deviations away from the middle band.
Why they’re useful for swing trading:
Volatility assessment: When the bands widen, it indicates high volatility; when they contract, it suggests low volatility, often preceding a significant price move (a “squeeze”).
Overbought/Oversold: Prices hitting the upper band can signal overbought conditions, while prices hitting the lower band can signal oversold conditions.
Reversal and Breakout signals: Prices often tend to revert to the middle band, and breakouts beyond the bands can signal strong trend moves.
5. Volume
What it does: Shows the number of shares or contracts traded over a period.
Why it’s useful for swing trading:
Trend strength: High volume often confirms the strength and conviction behind a price movement. A price increase on high volume suggests strong buying pressure.
Breakout confirmation: Breakouts from consolidation patterns are more reliable when accompanied by a significant increase in volume.
Reversal signals: Divergence between price and volume can signal potential reversals (e.g., price making new highs but on decreasing volume).
6. Support and Resistance Levels
What they do: Price levels where the price tends to stop falling (support) or stop rising (resistance).
Why they’re useful for swing trading:
Entry and Exit Points: Traders often look to buy near support levels and sell near resistance levels.
Breakouts: A strong break above resistance or below support can signal the start of a new trend or a continuation of an existing one.
Important Considerations for Swing Trading:
Combination is Key: No single indicator is perfect. Combining different types of indicators (e.g., a trend indicator with a momentum indicator and a volatility indicator) can provide more robust signals and help confirm trading ideas.
Timeframes: Swing traders typically use daily and weekly charts to capture medium-term price swings.
Risk Management: Always use stop-loss orders to manage risk and protect your capital.
Backtesting: Before implementing any strategy, backtest it on historical data to see how it would have performed.
Practice: Start with a demo account to practice your strategies before trading with real money.
Adaptability: Markets are constantly changing, so be prepared to adapt your approach and indicator settings as needed.
What is swing trading And day trading
Swing trading and day trading are both active trading strategies that aim to profit from short-term price movements in financial markets, but they differ significantly in their time horizon, frequency of trades, risk exposure, and lifestyle implications.
Here’s a breakdown of the key differences:
Day Trading
Definition: Day trading involves buying and selling financial instruments (like stocks, forex, or commodities) within the same trading day, with all positions closed before the market closes. Day traders aim to profit from small, intraday price fluctuations.
Characteristics:
- Time Horizon: Extremely short-term. Positions are held for minutes or hours, never overnight.
- Trade Frequency: High. Day traders may execute dozens, even hundreds, of trades in a single day.
- Profit Target: Small, frequent gains. The idea is to accumulate many small profits throughout the day.
Risk: High. The rapid pace and often magnified leverage can lead to significant losses if not managed meticulously. However, there’s no overnight risk.
- Required Capital: Often requires a substantial amount of capital, especially in regulated markets (e.g., in the US, the “Pattern Day Trader” rule requires a minimum of $25,000 in a margin account for frequent day trading).
- Analysis: Primarily relies on technical analysis (chart patterns, indicators, order flow) to identify short-term entry and exit points. Fundamental analysis is rarely used.
- Time Commitment: Requires full-time attention during market hours. Day traders must be constantly glued to their screens, making quick decisions.
- Stress Level: Very high due to the fast pace and constant need for quick decisions.
- Overnight Risk: None, as all positions are closed by the end of the trading day.
Swing Trading
Definition: Swing trading involves holding positions for a few days to several weeks to capture “swings” or price movements within a broader trend. Swing traders aim to profit from medium-term price changes.
Characteristics:
- Time Horizon: Short to medium-term. Positions are typically held for 2-3 days up to a few weeks.
- Trade Frequency: Lower than day trading. Swing traders might execute a few trades per week.
- Profit Target: Larger gains per trade compared to day trading, as they aim for bigger price swings.
- Risk: Moderate to high. While not as intense as day trading, there is overnight and weekend risk (i.e., market gaps due to news or events when the market is closed).
- Required Capital: Generally less than day trading, though still requires sufficient capital to manage risk.
- Analysis: Employs a combination of technical analysis (to identify entry/exit points and trends) and often some fundamental analysis (to understand the underlying company or market drivers) to select potential swing candidates.
- Time Commitment: Less demanding than day trading. While monitoring is still required, it’s not constant. Swing traders can manage their trades around other commitments.
- Stress Level: Lower than day trading, as decisions are less rushed.
- Overnight Risk: Yes, positions are held overnight, exposing traders to potential price gaps.
Key Differences
Summarized
| Feature | Day Trading | Swing Trading |
| Time Horizon | Intraday (minutes to hours) | Short to Medium-term (days to several weeks) |
| Trade Frequency | Very high (dozens/hundreds per day) | Moderate (a few per week) |
| Profit Target | Small, frequent gains | Larger gains per trade |
| Risk Exposure | High (due to leverage/speed) | Moderate to High (includes overnight risk) |
| Overnight Risk | None | Yes |
| Capital Req. | Often higher (e.g., PDT rule) | Generally lower than day trading |
| Analysis Focus | Primarily technical analysis | Combination of technical and fundamental analysis |
| Time Commitment | Full-time, constant monitoring required | Part-time, less constant monitoring |
| Stress Level | Very high | Lower |
Which is better?
Neither strategy is inherently “better” than the other. The ideal choice depends on an individual’s:
- Time availability: Do you have hours to dedicate to the market daily?
- Risk tolerance: How comfortable are you with high-speed decisions and magnified risk?
- Capital: Do you meet the minimum capital requirements for day trading?
- Personality: Can you handle intense pressure and rapid decision-making?
- Experience: Day trading is generally considered more advanced and risky for beginners.
